RECENT POSTS
- O que é um Invited Review?
- UTM 23S??
- FAQ about BJGEO
- Tutorial - São Paulo City LiDAR
- New site layout
- The SPAMLab has a website (and a blog)
- Publish anything with us (just need to pay 1200 Euros)
- I deleted my account at Academia.edu
- Denoising SRTM with GRASS-GIS
- Curso Internacional de Espeleoresgate 2016
- All posts ...
Denoising SRTM with GRASS-GIS
Dec 6, 2016 • CarlosGrohmann
Digital elevation data usually has some noise in it, but removing that noise may not be as easy as a simple filtering procedure. Using raster filters (mean, mode etc) in moving-windows operations will smooth the original topography. One solution is to perform the filtering with the XYZ information of each pixel (that is, treating the DEM as a point cloud and filtering the vector points).
In GRASS-GIS, we can use the r.denoise add-on to do this. The module was originally a bash script that I ported to python (because I needed to call it from a python script, and the bash version wasn’t working this way). The module itself is just a wrapper to the mdenoise (Sun et al., 2007; Stevenson et al., 20109) executable, which needs to be installed and in the system PATH.
To do that, download the source code of mdenoise and compile it:
wget http://www.cs.cf.ac.uk/meshfiltering/index_files/Doc/mdsource.zip
unzip mdsource.zip
cd mdenoise
g++ -o mdenoise mdenoise.cpp triangle.c
ln -s `pwd`/mdenoise /some/directory/on/the/$PATH
Once mdenoise is installed, start a GRASS session and install the add-on with g.extension:
g.extension r.denoise
In this post, I’ll show an example with 1-arcsec SRTM data for an area in the Amazon region, just north of the Barcelos city.
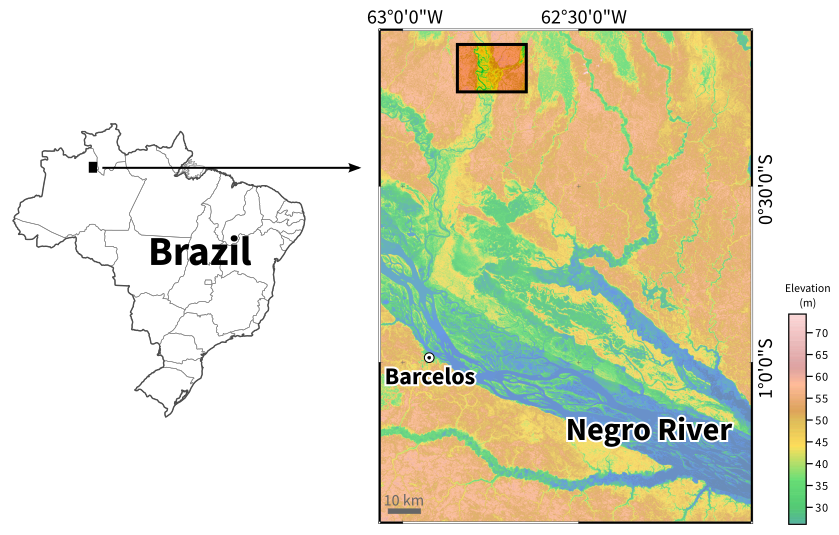
Location of the test area, in the Brazilian Amazon
Let’s check the original SRTM data.
In the image below, I used d.shade to drape the SRTM raster over a shaded relief image.
r.relief --overwrite input=srtm30m_north output=srtm30m_north_dnoise_shade_25_315_z5 altitude=25 azimuth=315 zscale=5

d.shade shade=srtm30m_north_shade_25_315_z5 color=srtm30m_north
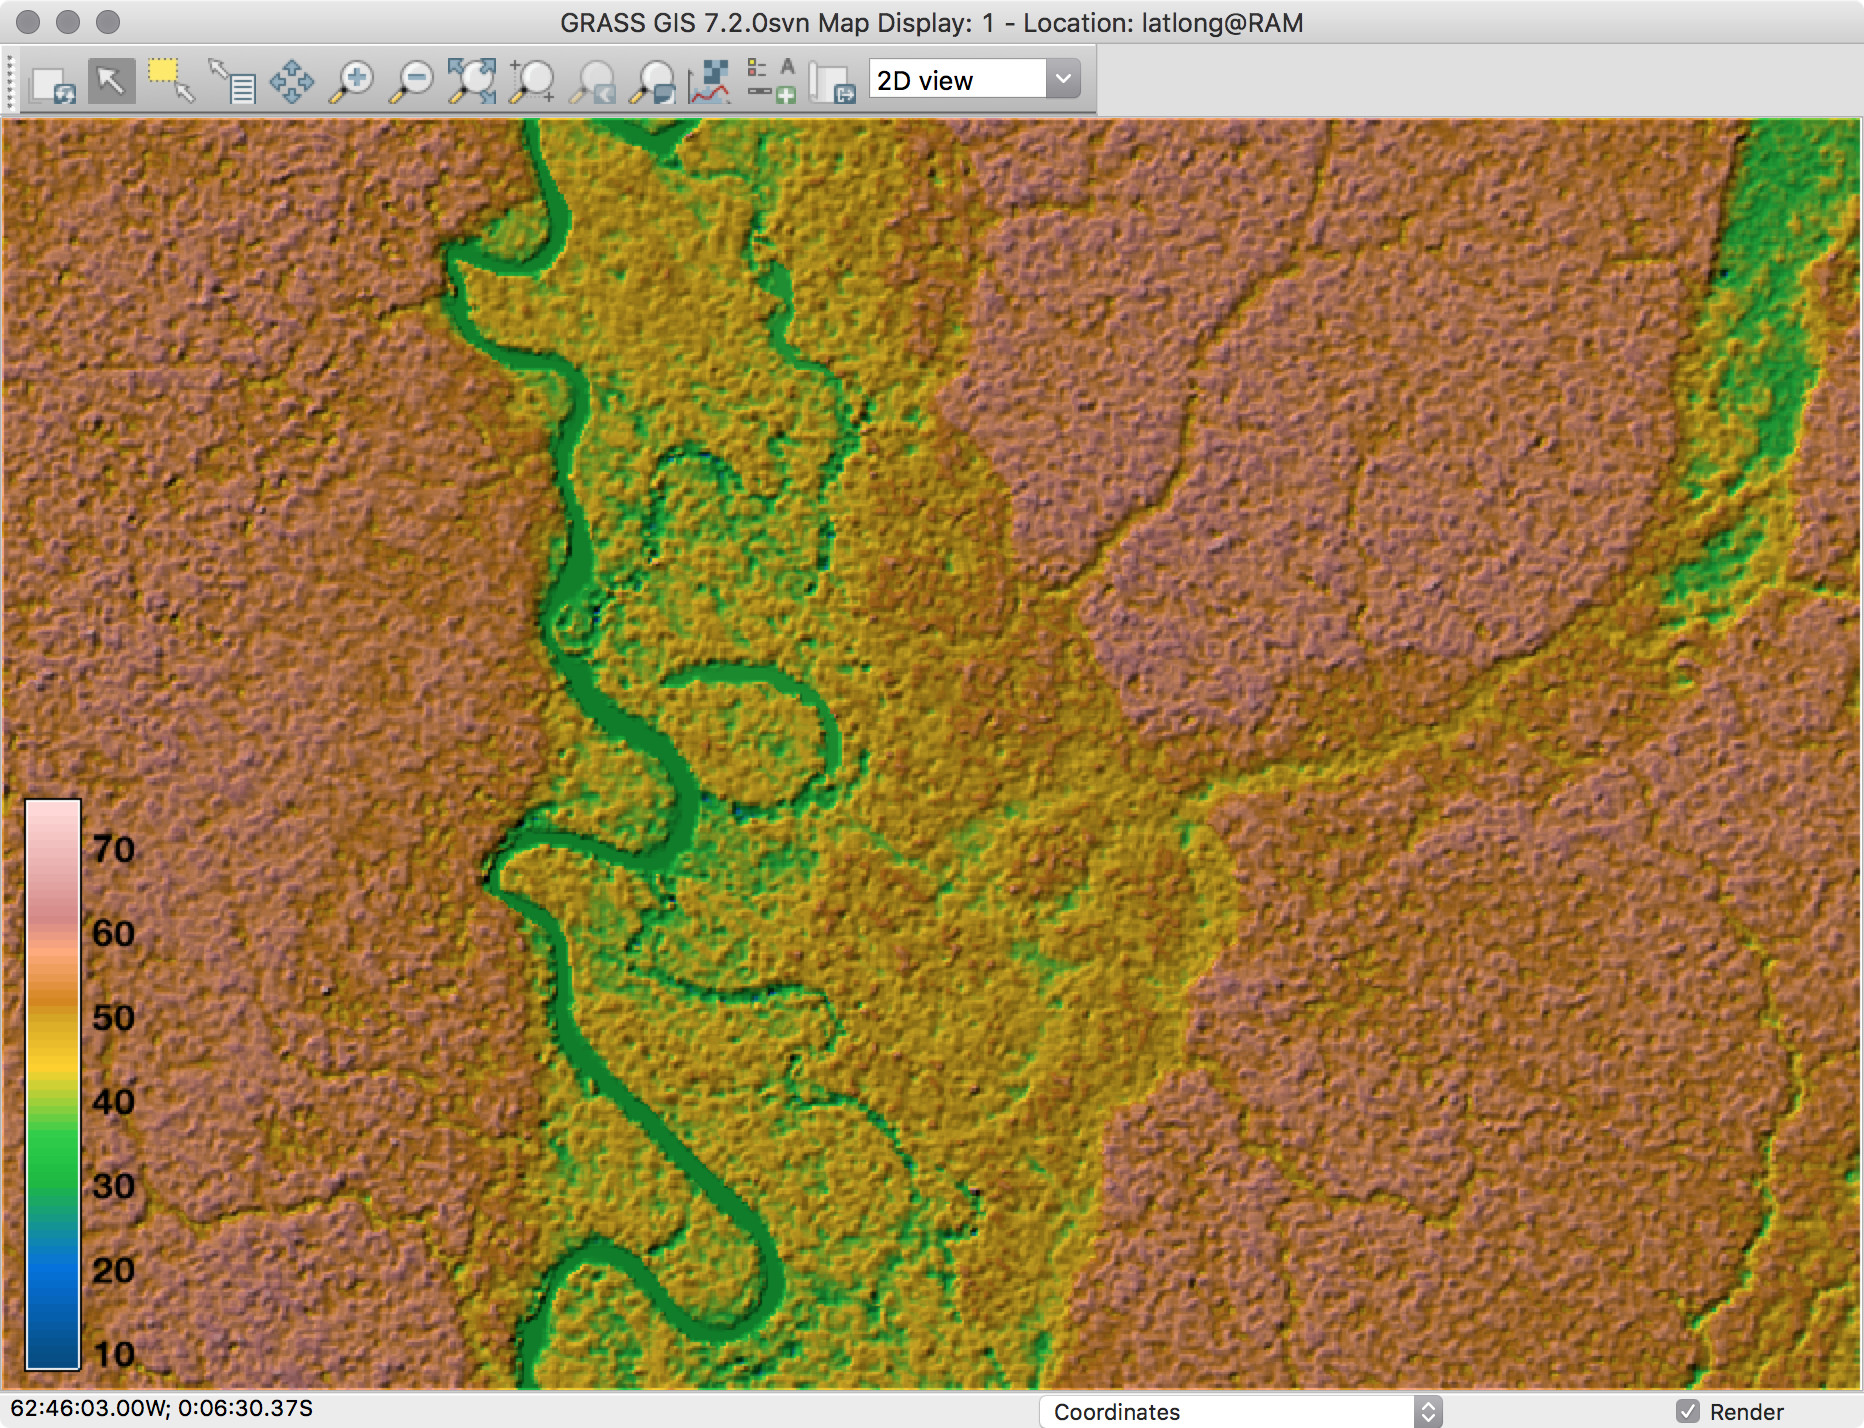
Original 1-arcsec SRTM data
We can see the noise in the image. Of course, some of it is probably due the forest canopy structure, but certainly not all.
Let’s run the r.denoise module and see the results. First, check the region settings:
GRASS 7.2.0svn (latlong):~> g.region -p raster=srtm30m_north
projection: 3 (Latitude-Longitude)
zone: 0
datum: wgs84
ellipsoid: wgs84
north: 0:05:53S
south: 0:13:58S
west: 62:50:42W
east: 62:38:53W
nsres: 0:00:01
ewres: 0:00:01
rows: 485
cols: 709
cells: 343865
Now run the module. The mdenoise executable does not work with geographic coordinates, and since I am working on a latitude-longitude location, I need to supply an EPSG code of a projected coordinate system, which will be used for reprojecting the data to a temporary file. In this case I used EPSG=32720, the code for UTM 20S WGS84.
We need to define two parameters, iterations and threshold. From the help page:
The amount of smoothing is controlled by the _threshold_ and _iterations_ parameters. Increasing the _threshold_ decreases how sharp a feature needs to be to be preserved e.g. decreases the smoothing. To preserve ridge crests in mountain areas, T > 0.9 is recommended. Setting T too high results in the preservation of noise. For SRTM data, which is already partly smoothed by NASA, T = 0.99 can be used. Increasing the number of _iterations_ increases the smoothing and the range of spatial correlation of the output dataset. A small number, e.g. 5 or fewer, typically gives the best results.
r.denoise --overwrite input=srtm30m_north output=srtm30m_north_dnoise iterations=5 threshold=0.9 epsg=32720</pre>
Here's the output of the command. For this test area, it took less than 5 seconds to denoise (10 seconds total) on my iMac (4 GHz, 32 GB RAM).
Exporting points...
Projecting...
Denoising...
Input File: tmp_xyz_proj_16395.xyz
Neighbourhood: Common Vertex
Threshold: 0.900000
n1: 5
n2: 50
Read Model...
Triangulation...
0.932 seconds
Denoising Model... 5.151 seconds
Saving Model... 0.186 seconds
Reloading data...
Reading input data...
Writing to output raster map...
r.in.xyz complete. 343865 points found in region.
Removing temporary files...
Removing temporary files...
(Tue Dec 6 11:26:10 2016) Command finished (10 sec)
To check the results visually, we can make the same color-shaded composition that we used for the original data:
r.colors map=srtm30m_north_dnoise@RAM raster=srtm30m_north@RAM

r.relief --overwrite input=srtm30m_north_dnoise output=srtm30m_north_dnoise_shade_25_315_z5 altitude=25 azimuth=315 zscale=5

d.shade shade=srtm30m_north_dnoise_shade_25_315_z5 color=srtm30m_north_dnoise
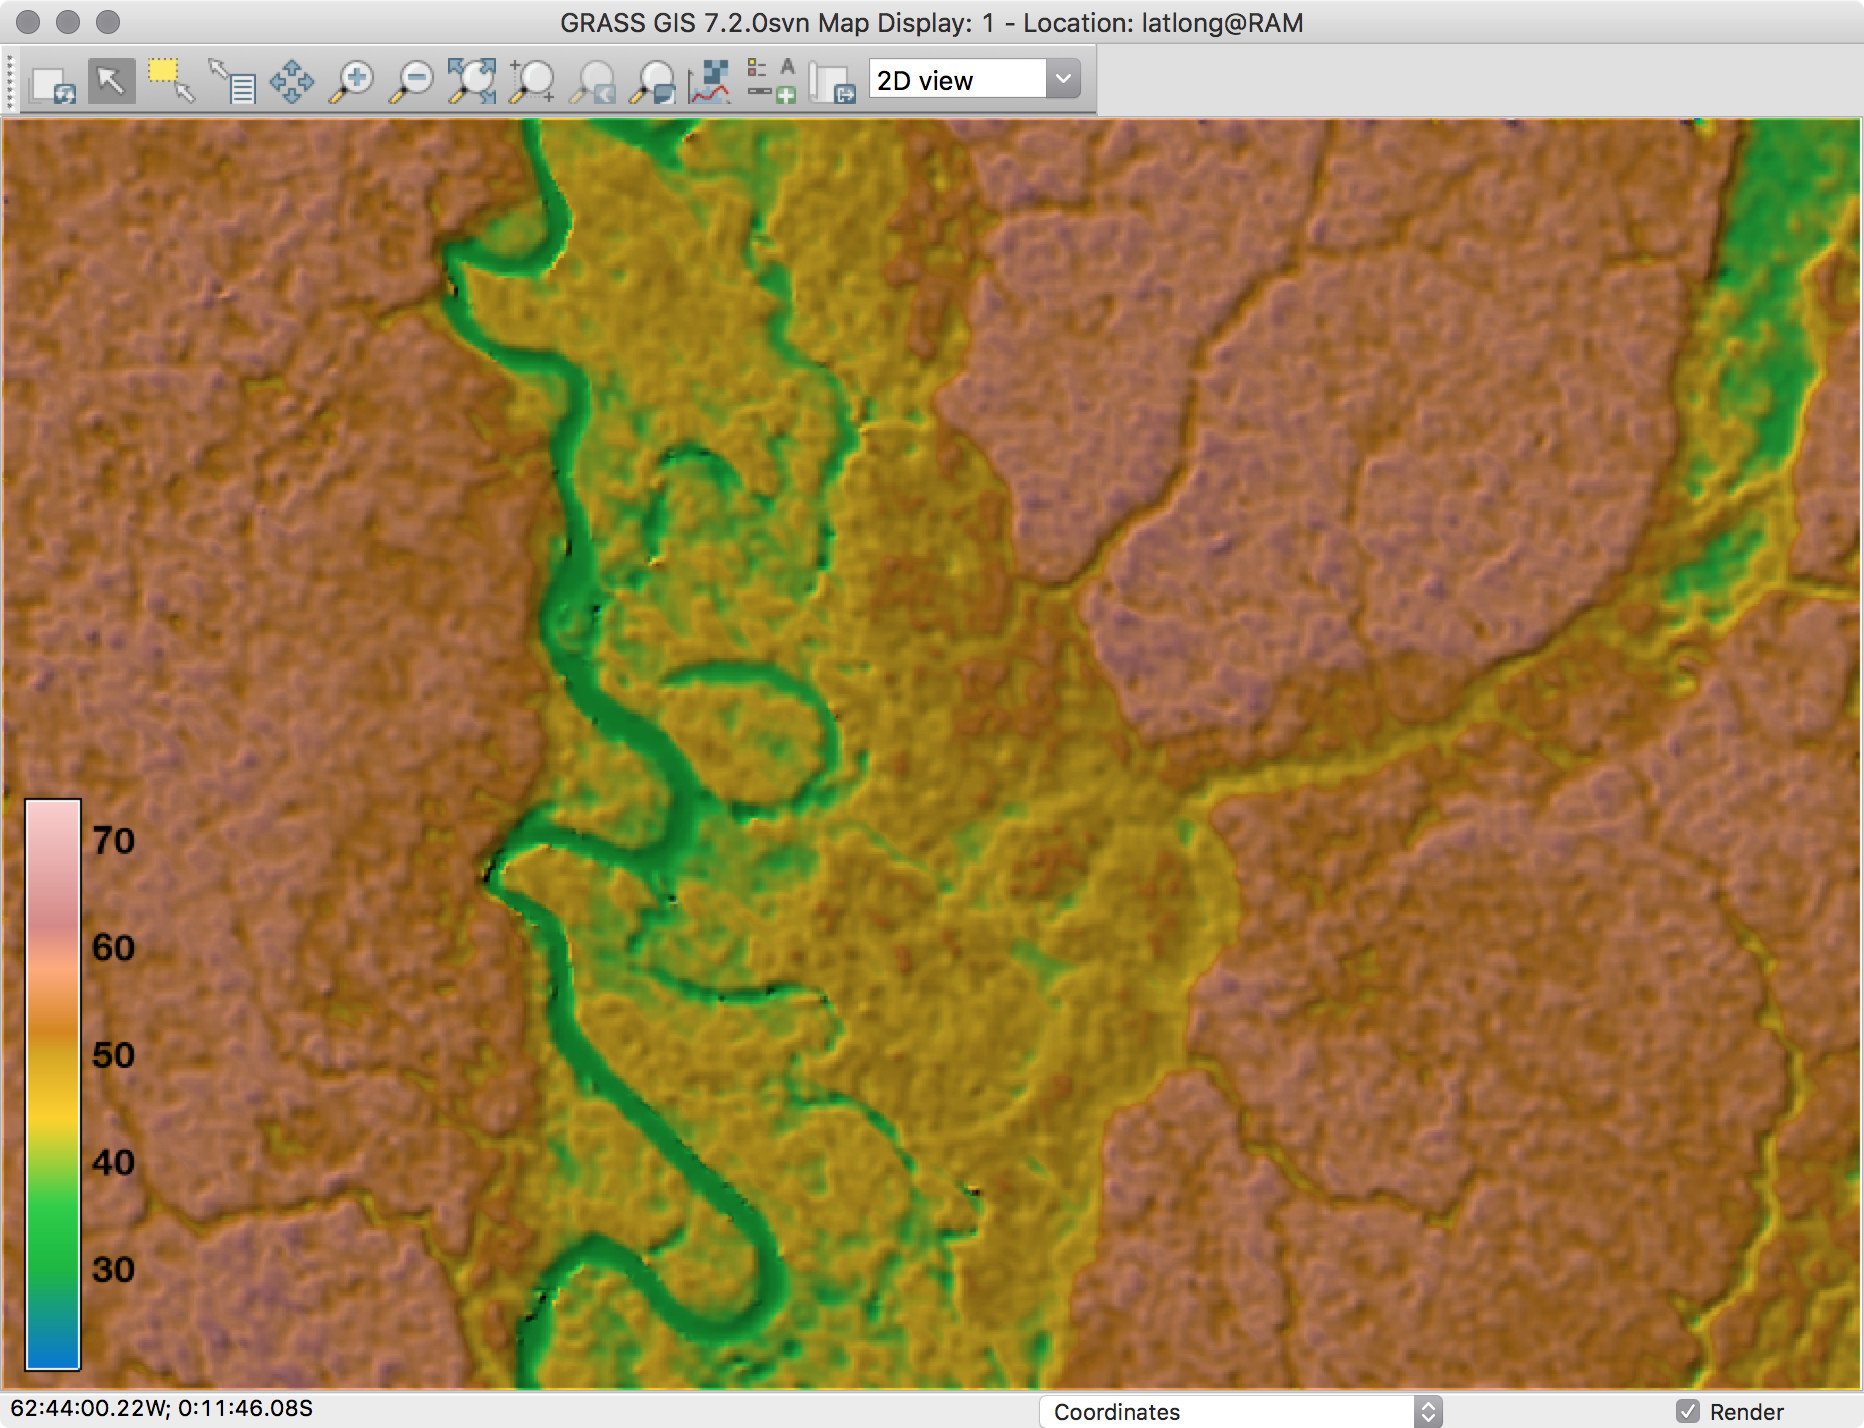
SRTM after denoising
In GRASS we can use the g.gui.mapswipe module to interactively compares two maps by swiping a visibility bar.
Some quick stats from r.info will show us that the range of elevation values changed a bit:
GRASS 7.2.0svn (latlong):~ > r.info srtm30m_north
 +----------------------------------------------------------------------------+
 | Map:      srtm30m_north                  Date: Wed Jan 14 14:32:07 2015    |
 | Mapset:   RAM                            Login of Creator: guano           |
 | Location: latlong                                                          |
 | DataBase: /Volumes/MacintoshHD2/grassdata                                  |
 | Title:    S01W063.SRTMGL1                                                  |
 | Timestamp: none                                                            |
 |----------------------------------------------------------------------------|
 |                                                                            |
 |   Type of Map:  raster               Number of Categories: 0               |
 |   Data Type:    CELL                                                       |
 |   Rows:         485                                                        |
 |   Columns:      709                                                        |
 |   Total Cells:  343865                                                     |
 |        Projection: Latitude-Longitude                                      |
 |            N:   0:05:53S    S:   0:13:58S   Res: 0:00:01                   |
 |            E:  62:38:53W    W:  62:50:42W   Res: 0:00:01                   |
 |   Range of data:    min = 8  max = 76                                      |
 |                                                                            |
 |   Data Description:                                                        |
 |    generated by r.in.gdal                                                  |
 |                                                                            |
 |   Comments:                                                                |
 |    r.in.gdal input="S01W063.SRTMGL1.bil" output="S01W063.SRTMGL1"          |
 |    r.in.srtm "-1" "input=/Users/guano/Desktop/S01W063.SRTMGL1"             |
 |                                                                            |
 +----------------------------------------------------------------------------+

GRASS 7.2.0svn (latlong):~ > r.info srtm30m_north_dnoise
 +----------------------------------------------------------------------------+
 | Map:      srtm30m_north_dnoise           Date: Tue Dec  6 11:26:09 2016    |
 | Mapset:   RAM                            Login of Creator: guano           |
 | Location: latlong                                                          |
 | DataBase: /Volumes/MacintoshHD2/grassdata                                  |
 | Title:    A denoised version of <srtm30m_north@ram>                        |
 | Timestamp: none                                                            |
 |----------------------------------------------------------------------------|
 |                                                                            |
 |   Type of Map:  raster               Number of Categories: 0               |
 |   Data Type:    FCELL                                                      |
 |   Rows:         485                                                        |
 |   Columns:      709                                                        |
 |   Total Cells:  343865                                                     |
 |        Projection: Latitude-Longitude                                      |
 |            N:   0:05:53S    S:   0:13:58S   Res: 0:00:01                   |
 |            E:  62:38:53W    W:  62:50:42W   Res: 0:00:01                   |
 |   Range of data:    min = 20.5162  max = 73.88921                          |
 |                                                                            |
 |   Data Source:                                                             |
 |    tmp_xyz_merge_16395.xyz                                                 |
 |                                                                            |
 |                                                                            |
 |   Data Description:                                                        |
 |    generated by r.in.xyz                                                   |
 |                                                                            |
 |   Comments:                                                                |
 |    r.in.xyz --overwrite -i input="tmp_xyz_merge_16395.xyz" output="srtm\   |
 |    30m_north_dnoise" method="min" type="FCELL" separator="space" x=1 y=\   |
 |    2 z=3 skip=0 zscale=1.0 value_column=0 vscale=1.0 percent=100           |
 |    Generated by: r.denoise srtm30m_north@RAM iterations=0.9 threshold=5    |
 |                                                                            |
 +----------------------------------------------------------------------------+
</srtm30m_north@ram>
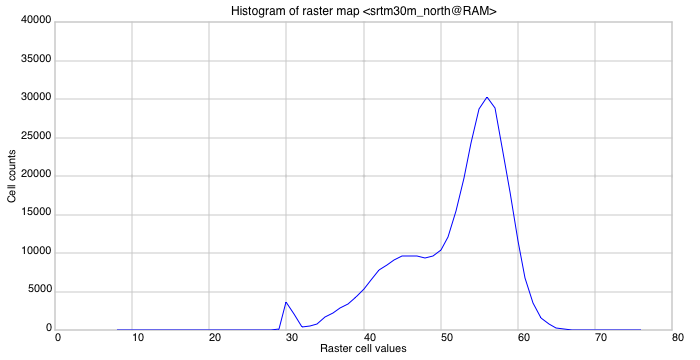
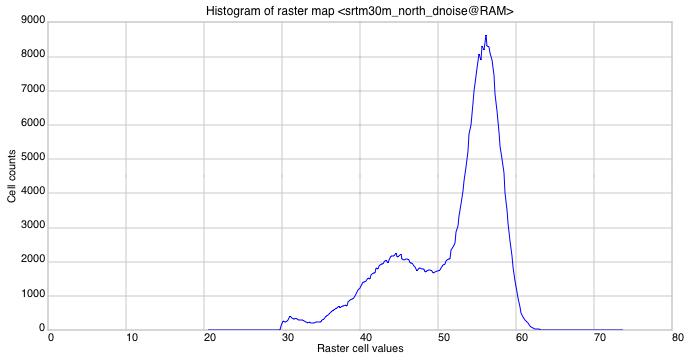
We can also see those changes in the histograms. The curves have the same general shape, but the original data has wider range and larger cell count for the same elevations in the denoised raster.
References
Sun X, Rosin PL, Martin RR, Langbein FC (2007) Fast and Effective Feature-Preserving Mesh Denoising. IEEE Transactions on Visualisation and Computer Graphics, 13(5):925-938 http://dx.doi.org/10.1109/TVCG.2007.1065
Stevenson JA, Sun X, Mitchell NC. (2009) Despeckling SRTM and other topographic data with a denoising algorithm. Geomorphology, 144:238-252. http://dx.doi.org/10.1016/j.geomorph.2009.07.006
For further information on denoising DEMs, see: Using Sun’s denoising algorithm on topographic data.